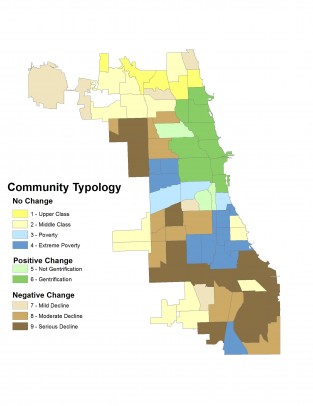
Gentrification index portrays Chicago neighborhoods, 1970-2010
More Chicago neighborhoods are declining than gentrifying, despite the greater attention given to gentrification, according to researchers at the University of Illinois at Chicago.
UIC’s Voorhees Center for Neighborhood and Community Improvement today released a report titled “The Socioeconomic Change of Chicago’s Community Areas (1970-2010).” The report centers on a gentrification index that indicates successive neighborhood change in each of Chicago’s 77 city-defined community areas.
The analysis quantified housing and household characteristics associated with gentrification, including:
- percent of white, black or Latino residents
- percent of residents aged 65 or over
- percent of children aged 5-19
- percent of residents holding a bachelor’s or higher degree
- median family income, adjusted for inflation
- percent of homes that are owner-occupied
- median home value, adjusted for inflation
- percent of families below the poverty level
- percent of residents with managerial, technical or professional jobs
- percent of households headed by women with children
- percent of children attending private school, pre-kindergarten through grade 12
“The 2010 map illustrates a city starkly divided, with high-scoring neighborhoods concentrated almost exclusively on the North and near-West sides of the city and low scores concentrated on the city’s South Side,” the report states.
High-status community areas grew in number from 18 to 23 over the four decades, while low-status areas grew from 29 to 45. Middle-status areas decreased dramatically, from 30 to 9, coinciding with the loss of jobs and families to the suburbs, the researchers suggest.
The greatest gentrification occurred in the Loop and adjacent areas of the North and West sides. Other gentrifying areas lie along the Chicago Transit Authority’s Red and Blue train lines.
By contrast, large sections of the West and South sides farther from the Loop have been “hollowed out,” the researchers say.
The report notes the greatest changes decade by decade:
1970-1980: The Loop and Lincoln Park showed significant upgrades, while Austin experienced an even more significant decline.
1980-1990: North Center showed moderate growth. Rogers Park and New City declined — the second consecutive decade of decline for New City, an area containing the Back of the Yards and Canaryville neighborhoods.
1990-2000: Eight areas declined on the South Side, particularly Chicago Lawn. Significant upgrades occurred in West Town and Near South Side, along with a more moderate upgrade in Lincoln Square.
2000-2010: For the first time, more communities saw positive change than negative. The Near West Side community area underwent the greatest upgrade due to new housing. Near South Side and West Town saw a second consecutive decade of growth, becoming upper-status communities. “This decade in particular deepened the divide between rich and poor in Chicago,” observes Janet Smith, Voorhees Center co-director.
“A combination of things happened,” said Smith, lead author of the report.”Higher-income people continued to move into the city and spread from downtown west and north; middle-income families moved out; and income stagnated or declined among lower-income workers who remain near or below poverty level.
“We hope that our findings will prompt policy makers, elected officials, philanthropists and others invested in Chicago’s neighborhoods to work together toward creative solutions for balanced healthy neighborhood development and quality of life,” Smith said.
The index is part of a larger project on gentrification, housing and education that the Voorhees Center will lead in the coming months. In partnership with the Chicago Rehab Network and the Collaborative for Equity and Justice in Education, Voorhees will host community workshops in early 2015 to discuss the implications of the Gentrification Index, introduce a toolkit for communities, and hear how Chicagoans think city government should respond.
